Month: April 2021

Computers 9 10 Team Ocelot : Natural Disaster

Start a natural disaster project: not a waterfall, but a geyser, rock slide, earthquake, etc.

It should be at least 5 seconds long, give each layer a good descriptive name.

You should have at least 6 layers,  at least 120 frames, the action of the natural disaster should include at least  30 keyframes as a progression (as in stuff moves or changes a bit each keyframe for 30 frames), you need an animal and a plant that is affected by the natural feature,  a sound that matches the feature (if you can find a good sound website) and the area needs to be changed by the feature..

Here is an incomplete example, don’t copy it, make your own! Also this example doesn’t have an animal.

Nature-(Made-from-Weather-starting

rechargeable-lol-cat2

Computers 10 uses Fire Effect, it’s super effective!


Hey everypony!

great_pony_of_fire_by_macgrubor-d6nxeki

For our next photoshop project, I would like you to use photoshop to set something on fire digitally, that was not actually on fire.

I have a tutorial that I found on the net that is pretty cool, but it is a bit vague. It tells you to do stuff that you probably know how to do, but without saying how to do it step by step.

I don’t want you to think that Computers is a hard class, just that you should work hard in class if you want a good mark, so I am not going to make everyone do that tutorial.

If you want to try and do the tutorial I like, here it is: this

You should use a different picture than the one in the tutorial though.

If you try it out and it’s too confusing, stop doing it (on the first day) and find your own fire in photoshop tutorial and follow it, just use a different picture than the one in the tutorial.

If you can’t find one that is good and easy try this one:

But use something that is not a guitar!

When you hand in your finished document, give me three things: 1, the original picture, 2, the picture modified so it looks like it’s burning, 3, a word document with the website you got the tutorial from.

Okay?

Cool! I mean hot, ‘cuz we are playing with (digital only please) fire.

Computers 9 10 Ocelot: Infographic Hobby

Hi, do you know what this is?

floppy-8

It could store 720 kb of memory. It’s an 8 inch floppy disk.

storage-8inch-floppy

That’s how big it was, and it couldn’t even store more than half of an mp3.

It got replaced by the 5 and a quarter inch disk.

5-and-8

Those 5 and 1/4 inch disks got replaced by this:

dysan_floppy_disk_01

That puppy is less than half the size (3.5 inches) and could store twice as much 1.44 mb which is about the size of a regular quality mp3 for a song.

Why am I talking about this ancient technology?

floppy-family

Because you sort of knew what this thing was all along. You see it every time you push the save button for almost anything, because it is the save icon.

A good  Icon is a picture that represents something really well. You know what it does, because you know what it represents.

Like this:

doom-health-pack

That’s a health pack from the video game DOOM, the original one. Now all health packs or first aid kits in video games look like that, because the design comes from the red cross organizations icon.

You know now what an icon is, and how popular (and long lasting) they can be if they are well designed.

You are going to make an infographic about yourself or one of your hobbies. You will need to give information in text and graphics about it. You will need to have something that you can give us at least 8 different bits of information about. You need to decide your topic and what those 8 things are going to be, then you need to design icons for them. Sometimes, there already will be an icon that fits, you can just draw your own version of it. Other times you will have to make an icon for it.

Infographic :  Steps:

  1. Decide on your topic. Choose something that interests you and has numbers and visuals. You will need a subject that can have at least 8 different sections.

2.Come up with a list of items that you want to show in your infographic.

  1. Make a new document in photoshop  that is either long or wide, depending on how you want your infographic to look. 
  2. Work down your list, linking the layers that are for each item, so if you move them around they go together.
  3. Make an icon for each item on your list.
  4. Type the text for each item.
  5. link the layers of each item and text that relate to the topic together.
  6. When you are done with all the items, move them around on the document until they look cool. Don’t make it look in too much of a grid shape.
  7. Add lines to separate items where needed.
  8. Save the image with a different name, like infographic yourname original.
  9. Save the image with another name like infographic yourname merge.

12.With infographic yourname merge ONLY,  Merge down all the layers to make them one. Don’t do this step with the other file, that way you can change stuff around if you need to later.

  1. Find a background image that is colorful and matches the topic of the infographic.

Source: http://thepicinicbasket.blogspot.ca/2014/05/how-to-make-infographic-using-photoshop.htm

Here is an example with 2 things done. There’s six more to go!

Computers 10 : Column/bar Graphs

Hey, the next project is to do the same thing we did with the pie charts, but use bar graphs instead. You will make 4 Column or bar graphs, with each graph having 5 answers.

You can just make the numbers up again!

Cool huh?

So just use excel to make the column graphs (bar graphs are ok too), and then use photoshop to fill the graphs with the picture of the thing that the graph represents.

Here is an example:

column example

Computers 9 10 Ocelot: Pie charts and Bar Graphs

Hey there!

You are going to make 2 bar graphs and 2 pi charts, and they are going to have at least 3 things in each graph.

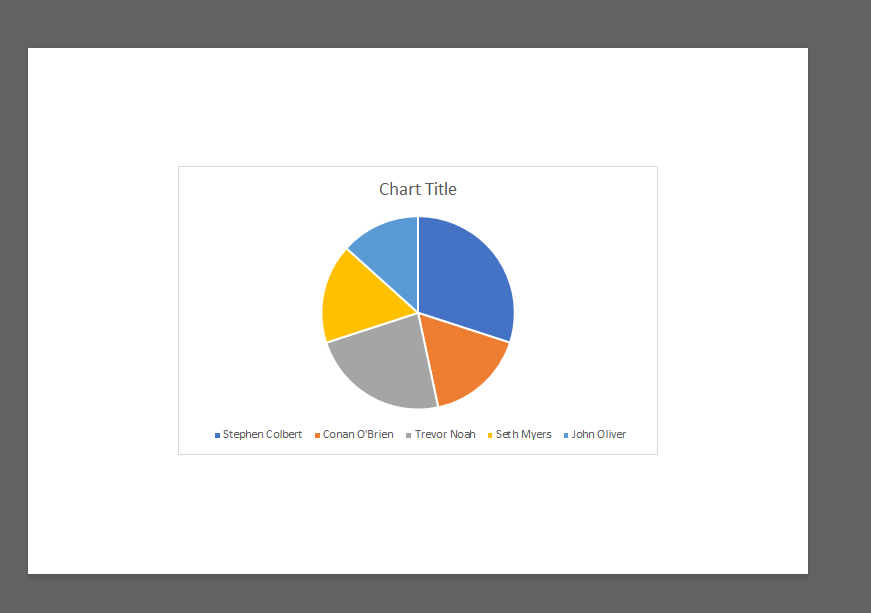
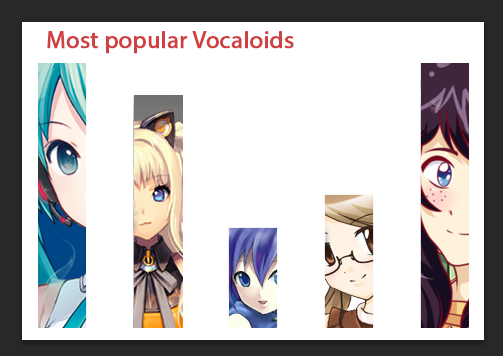
Here is an example of a Pi chart with 5 different things in it, you only need to have 3.

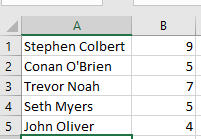
Let’s pretend you asked a class whos the best late night host and your choices were:

a) Stephen Colbert, b) Conan O’Brien, c) Trevor Noah, d) Seth Meyers, e) John Oliver

Then you are going to pretend that everyone in a class of 30 gave you an answer.  Open up Excel and make two columns that will look sort of like this: Names on one side, and people who gave that answer on the other. Make sure your imaginary people give each possibility at least 3 answers.

Excel 1

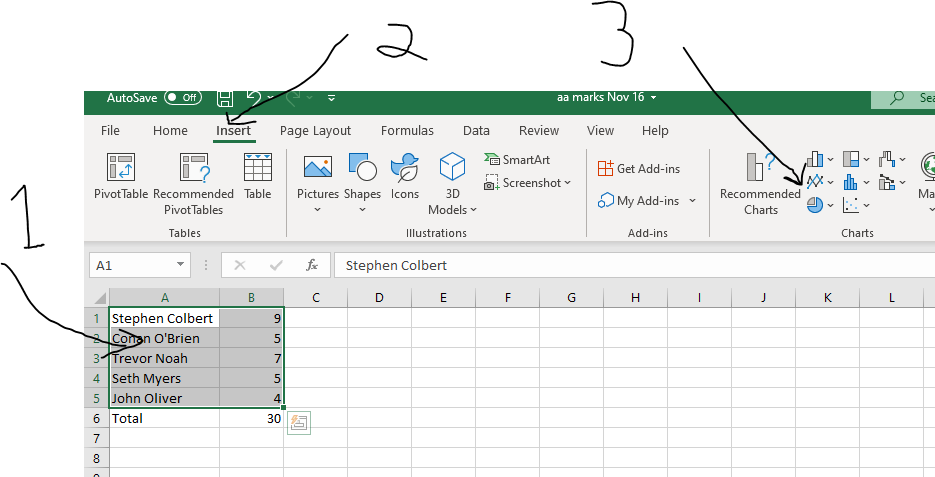
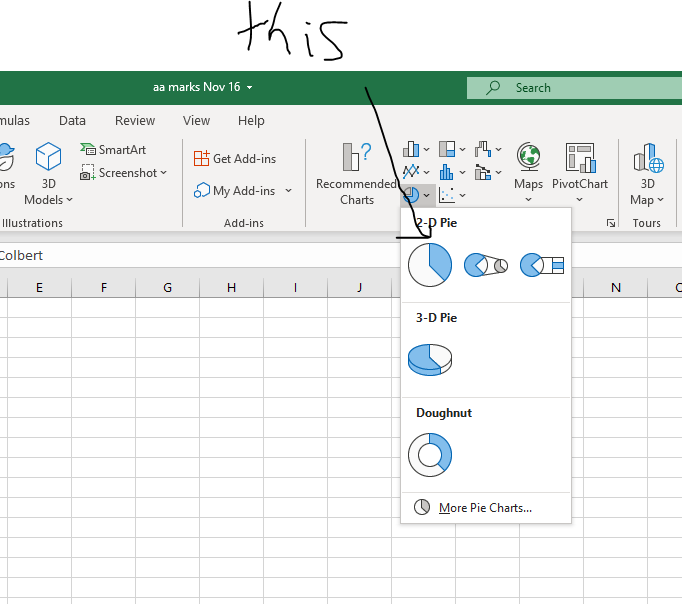
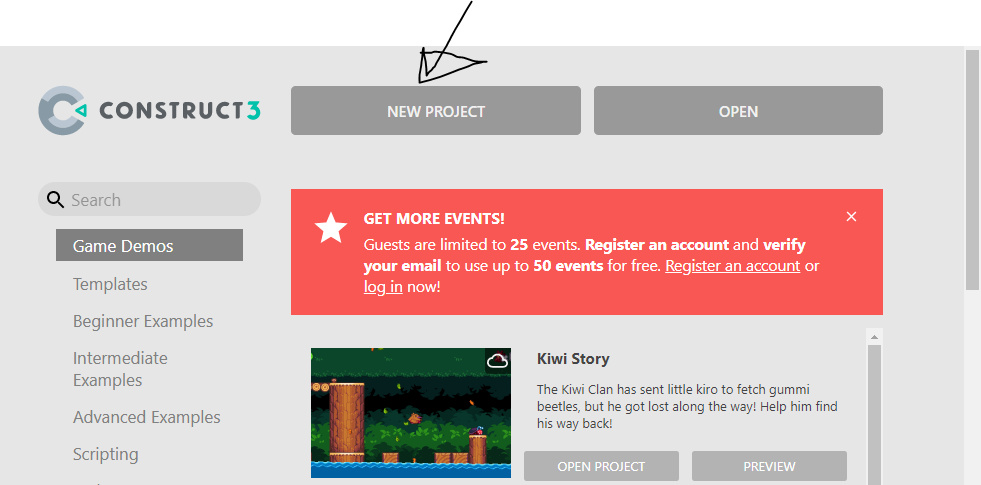
Then make a pie chart by selecting both columns and then using the insert chart command.  First select both columns, then (2) Click the insert tab, and select pi chart (3).

pi chart example hosts

pi chart host excel last step

pi chart made

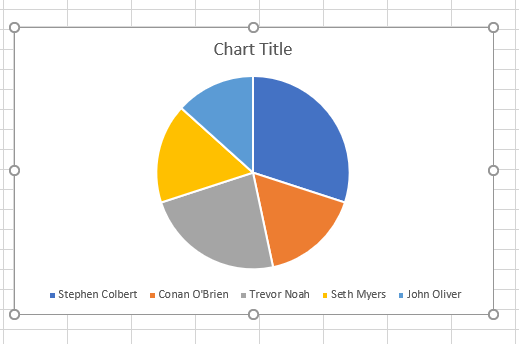
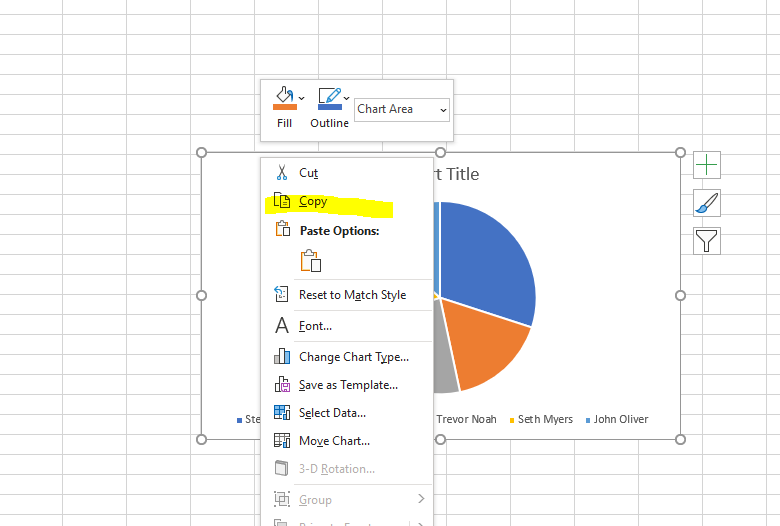
Next  select the pie chart and copy it. Right click in a blank area of the chart and select Copy.

Copy pi

Next, in Photoshop Select File> New> Clipboard.

Clipboard pi

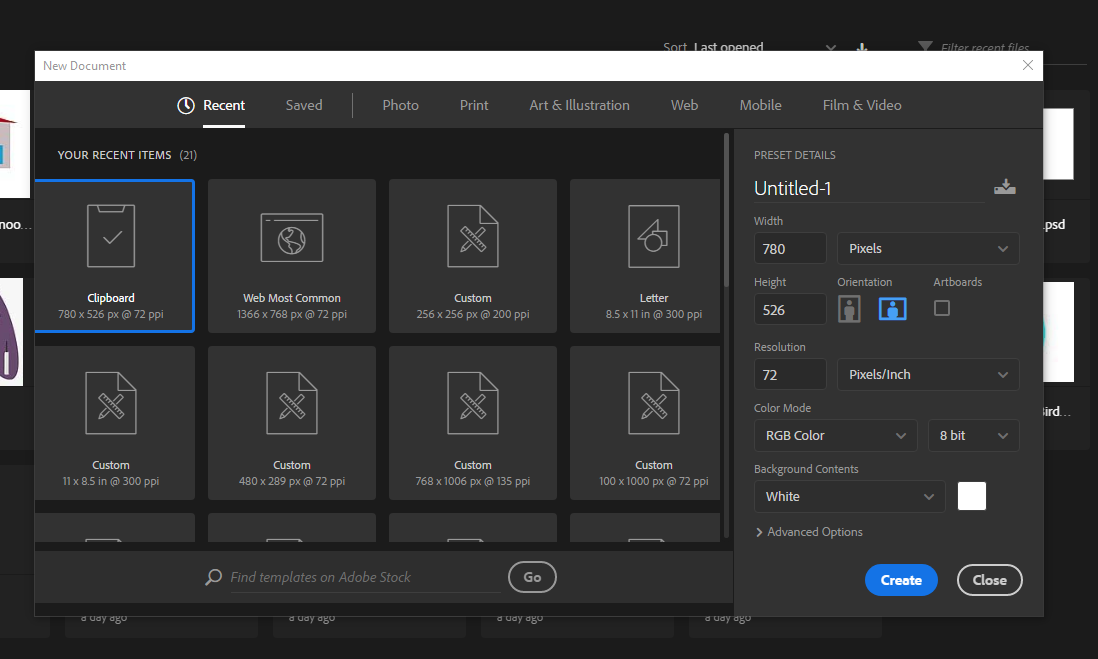
This will make a document the size of your copied chart.  Go to the new photoshop document and press CRTL +V to paste it in to the document.

in PS pi

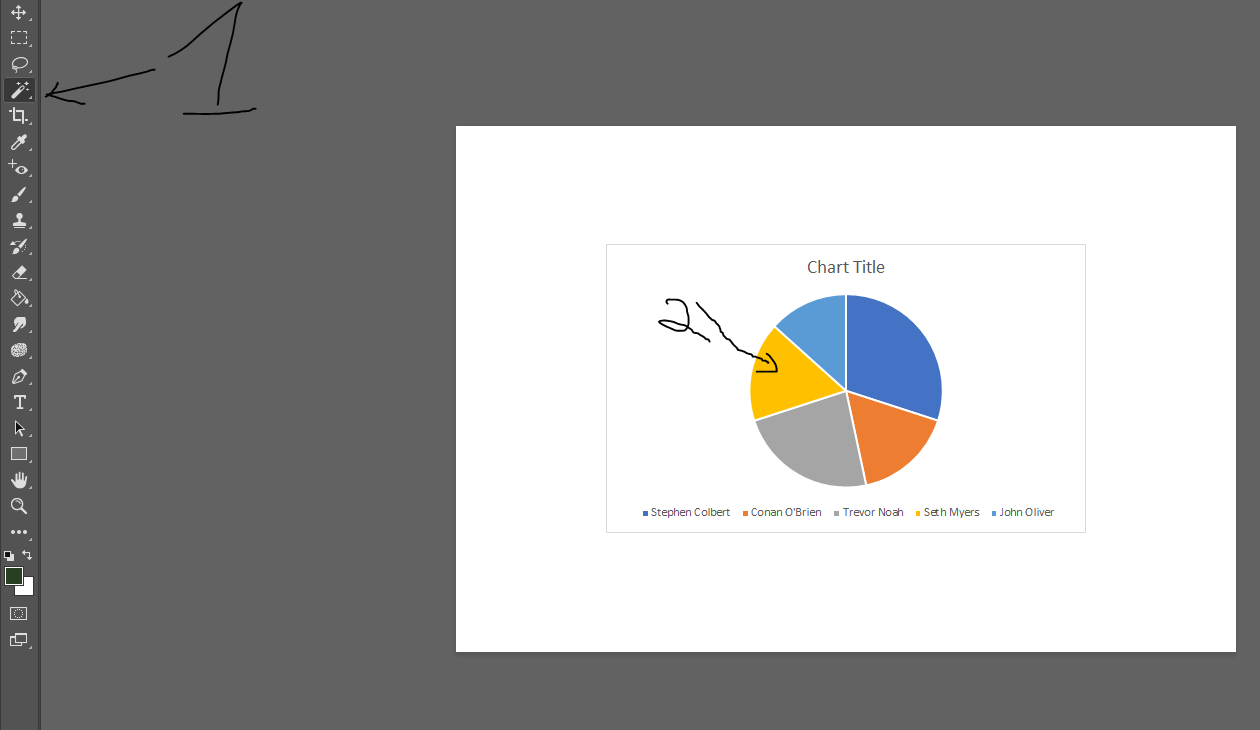
Choose the magic wand tool and choose one of the colors to select it.

Wand pi

Then get a picture that color represents and use the clone stamp to color it in that spot.

CloneRemember to use the clone stamp, you have to hold down ALT and left click the place you want to copy from. Then you go to the place you want to paint the clone in, and just left click and draw it there. Sometimes you have to change the size of the thing you are cloning to make it fit. To do that, click IMAGE>IMAGE SIZE and then change the numbers. Usually you have to make them smaller. If you made them too small you can always hold CRTL + ALT +Z and tap until the image returns to the old size, then pick a different number and try again.

I chose yellow here, which in my chart is Seth Myers. So I will grab a picture of him and clone stamp it there, completely filling up the yellow part of the graph.

Seth pi done

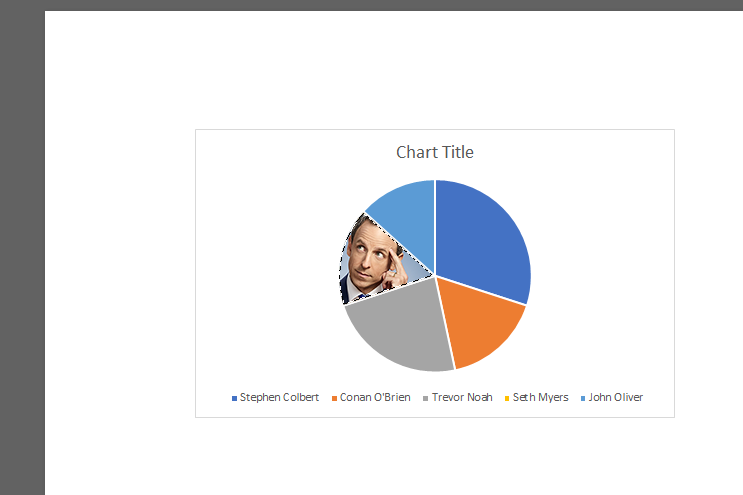
Then I repeat the magic wand. then clone stamp steps for the other hosts.

pi host done

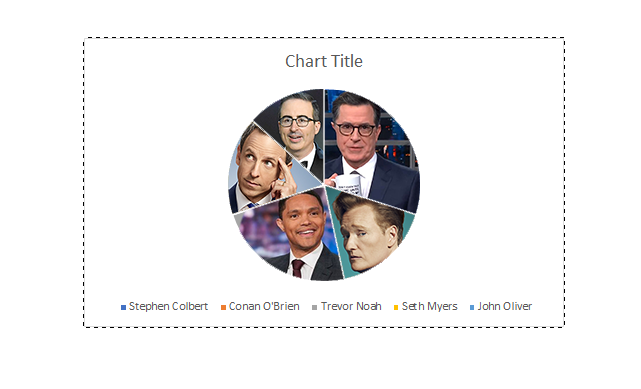
Lastly, I use the eraser to get rid of text I don’t want (Chart Title) and the text tool to put the question next to the chart.

Hosts pi all done

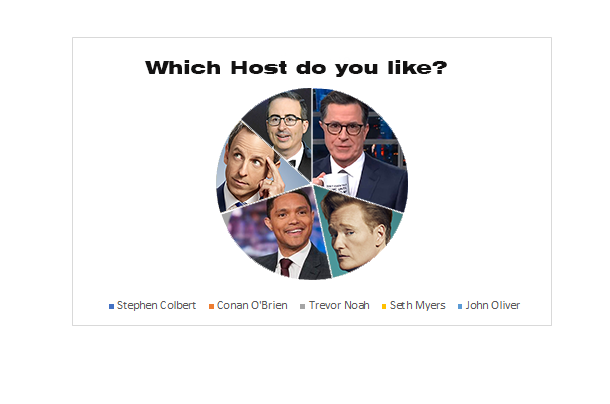
Repeat these steps for three more questions, so at the end, you should have 2 cool pie charts, and 2 cool bar graphs with 3 choices each. Hand it in as yourname_pi chart1 and __2, and Bar graph 1 and 2.

Here is an example of a bar graph:

column example

By the way, all these people are great and funny talk show hosts, but the best talk show host was this guy.

Craig-Fergusen

For a bonus mark, make another pie chart with 4 things about him.

Computers 10: 3 Signs Project

Hi everyone,

as soon as you are finished the 9 things on a tenth project, you should start the 3 emoji sign project.

Make 3 emoji like signs that don’t exist yet.

1: an emoji sign for cats telling them to do or not do something,

2, and an emoji sign for aliens visiting earth explaining incorrectly a weird thing humans do. They are aliens so they should make a mistake for what humans are doing. For example, maybe they think humans are trying to warm up cold horses backs by riding them.

3, an emoji sign for an animal that lives in the water talking about something land animals do, that water animals don’t. This should also be incorrect, because water living animals (marine animals) wouldn’t understand land animals.

The emoji should only use symbols, not words, and you have to draw it all yourself. You can use the brush tool, the shape tools, the paint bucket, and the eraser tool. This assignment should be in 3 separate files.

Japanese Highway sign

Take a look at this emoji like sign from Japan. What is it telling you?

Pretty neat, huh? No words, but you can get the meaning. That’s what your emoji signs should do.

Don’t forget in photoshop click File>new> then choose a size. I like Web> Web most common.

Computers 9: Construct 3

Hello,

Today we are going to start construct 3. Go to this website:

Construct 3

Step the 1

Click try now.

step the 2

Click Launch Now

Step the 3

Click New Project

step the 4
Give your project a cool name

step the 5

step the 6

Start following the tutorial.

To Save your work, follow these four steps (click where the arrow points)

Remember to move or copy the downloaded file to your documents so it’s easy to find.

save pro 1save pro 2save pro 3save pro 4